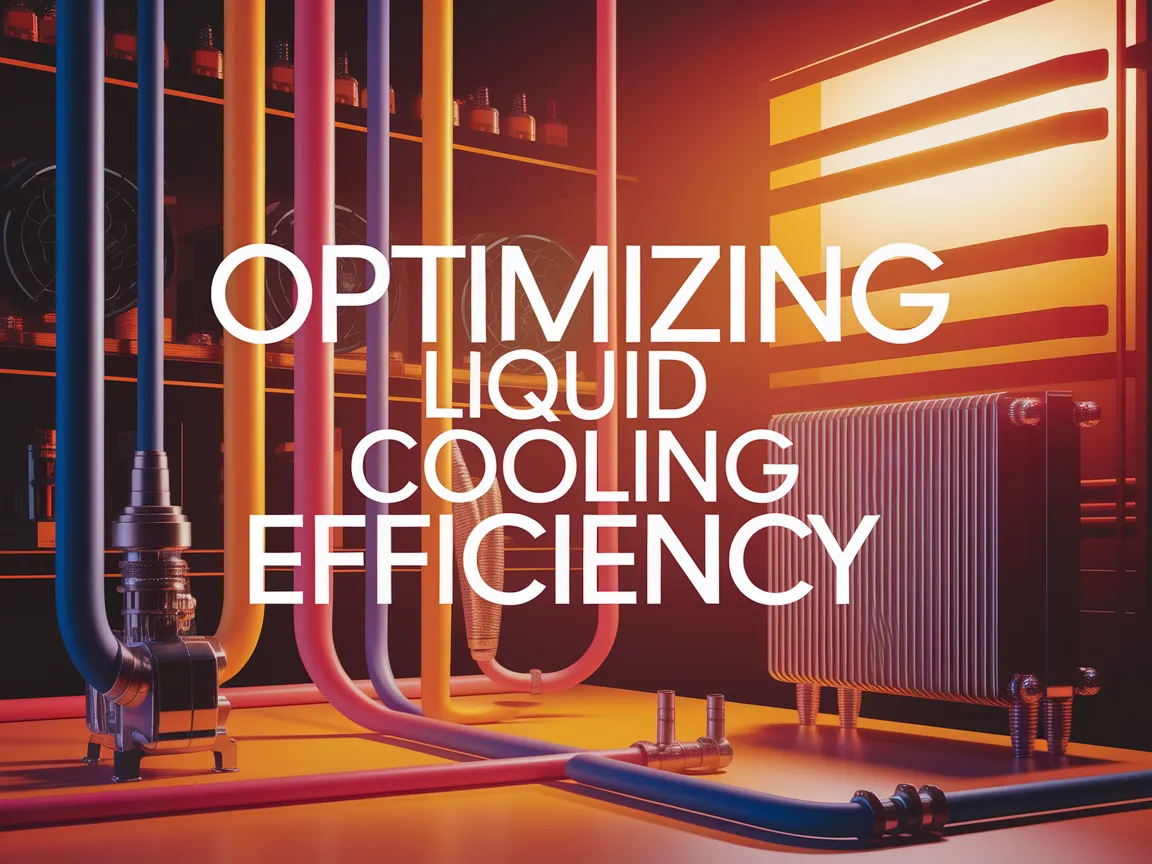
Liquid Cooling Loop Pressure Drop Calculations
Liquid cooling loop pressure drop calculations measure hydraulic resistance as coolant flows through battery thermal management systems. This determines energy needed to circulate fluid while maintaining target temperatures.
Accurate pressure drop analysis directly impacts pump selection and overall battery pack efficiency. Incorrect calculations risk poor thermal control or excessive parasitic power loss.
We’ll examine key factors like coolant properties and component design affecting pressure losses. You’ll learn practical calculation methods to optimize cooling performance.
Fundamentals Of Liquid Cooling Loop Pressure Drop in Battery Packs
Contents:
Pressure drop analysis forms the hydraulic backbone of battery thermal management systems. We’ll examine its core principles and operational significance for electric vehicle and stationary storage applications. Effective thermal management strategies are crucial to maintaining optimal performance in these systems. Implementing robust busbar thermal management strategies helps in managing heat distribution and enhancing overall efficiency.
Defining Pressure Drop in Battery Cooling Systems
Pressure drop (ΔP) measures the hydraulic resistance as coolant flows through battery cooling loops. It’s quantified as the difference between inlet and outlet pressure across components or entire systems.
This resistance arises from friction against channel walls and directional changes in flow paths. Every bend, fitting, and restriction contributes to cumulative pressure losses measured in kPa or psi.
Why Pressure Drop Matters for Battery Thermal Management
Excessive ΔP forces pumps to work harder, increasing parasitic power draw by 15-30% in typical battery systems. This directly impacts electric vehicle range and energy storage efficiency.
Inadequate flow distribution from unbalanced pressure drops creates thermal hot spots in battery modules. Cells may experience 8-12°C temperature differentials when flow isn’t properly managed.
Proper ΔP management ensures uniform cooling across all battery cells while minimizing pump energy consumption. It directly influences both thermal performance and system longevity.
Critical Factors Affecting Pressure Drop in Battery Cooling Loops
Multiple elements govern hydraulic resistance in battery thermal systems. Component design, fluid behavior, and layout choices collectively determine total pressure drop. This hydraulic resistance is crucial in understanding how thermal runaway mechanisms can develop in lithium batteries. Effective thermal management can prevent dangerous situations where excessive heat leads to battery failure.
Optimizing these factors prevents excessive pump power consumption. It ensures uniform temperature distribution across battery modules.
Component-specific Pressure Loss Contributors
Every physical element adds resistance to coolant flow. Pressure losses vary significantly across different hardware configurations.
Cold plates and heat exchangers
Microchannel designs dominate modern cold plates. Fin density directly impacts resistance – 20 FPI plates create 40% more ΔP than 12 FPI equivalents at 0.5 L/min flow.
Port geometry causes entrance/exit effects. Sudden contractions/expansions may add 0.2-0.8 kPa per cold plate in battery modules. The design of a BDU plays a crucial role in ensuring efficient energy transfer and minimizes pressure variations in battery systems. A well-thought-out functional design of the battery disconnect unit helps optimize performance and reliability.
Manifolds and piping networks
Z-type manifolds often create 15-25% flow imbalance between parallel branches. Herringbone designs reduce this to under 5% but increase ΔP by 8-12%.
Tube diameter critically affects friction loss. Halving diameter increases pressure drop by 32X according to Poiseuille’s law.
Fluid Properties Impacting Pressure Drop
Coolant characteristics fundamentally alter hydraulic behavior. Temperature variations further complicate predictions.
Coolant viscosity and density
Ethylene glycol/water blends increase viscosity 200-400% versus pure water. This directly elevates pressure drop by similar factors at low temperatures.
Density affects inertial losses in fittings. Coolant with 1100 kg/m³ density experiences 10% higher ΔP than water at same velocity.
Temperature-dependent property changes
Viscosity drops 50-70% when coolant heats from 20°C to 60°C. This reduces cold plate ΔP by 35-45% during operation, complementing efforts in thermal interface material thickness optimization.
Density decreases 4% over same range. These nonlinear changes require temperature-adjusted calculations.
System Design Considerations
Physical architecture significantly influences total hydraulic resistance. Smart routing minimizes unnecessary losses. Proper clearance can be crucial when aligning various components, as it helps maintain system efficiency. Busbar routing clearance requirements ensure that electrical systems operate safely without interference, reducing the risk of failures.
Flow path complexity and routing
Each 90° elbow contributes 0.5-1.5 kPa equivalent pipe length. Minimizing bends cuts total loop pressure drop substantially.
Parallel flow paths must have balanced resistance. Mismatched branches cause hot spots in battery packs.
Fitting and valve selections
Ball valves add minimal resistance (0.1-0.3 kPa). Needle valves may cause 2-8 kPa loss depending on opening position.
Quick-connect fittings typically add 0.4-1.2 kPa per connection. Compression fittings offer lower resistance.
Calculating Pressure Drop in Battery Cooling Loops
Accurate pressure drop calculations require systematic approaches. Combining theoretical models with empirical data yields reliable predictions.
Segment-based analysis captures localized effects. Component-specific methods address unique flow behaviors.
Core Equations and Calculation Methodology
Fundamental fluid dynamics govern cooling loop pressure drops. Two key parameters anchor all calculations. Proper management of these dynamics is crucial, especially when considering potential thermal runaway scenarios. Understanding the pathways for venting gases during a thermal runaway event can help prevent dangerous eruptions and ensure safety in various applications.
Darcy-Weisbach equation applications
ΔP = f × (L/D) × (ρv²/2) calculates straight pipe losses. Friction factor (f) depends on surface roughness and Reynolds number.
For rectangular channels, hydraulic diameter replaces D. Cold plate calculations often use this adaptation.
Reynolds number considerations
Re = (ρvD)/μ determines flow regime. Below Re=2300 indicates laminar flow with f=64/Re.
Turbulent flow (Re>4000) uses Colebrook equation. Transitional regimes require careful interpolation.
Step-by-step Calculation Process
Systematic analysis prevents oversight of critical losses. Follow this sequence for accurate results.
Segmenting the cooling loop
Divide the loop into discrete hydraulic sections. Typical segments include straight tubes, bends, cold plates, and manifolds.
Identify parallel and series flow paths. Battery packs often combine both configurations.
Summing component pressure drops
Calculate each segment’s ΔP using appropriate methods. Sum series resistances directly.
For parallel paths, determine flow distribution iteratively. Balance until pressure matches across branches. When optimizing flow distribution, considering different configurations can also enhance system performance. Series parallel cell configuration strategies allow for flexible adjustments in fluid flow, improving efficiency in various applications.
Practical Calculation Example for Battery Pack
Consider a 20kWh battery pack with parallel cooling. Each branch contains 5 cold plates in series. Effective thermal management is crucial for optimizing battery performance and longevity, and it can be approached at both the module and pack levels. The choice between module level and pack level thermal management can significantly impact the overall efficiency of the battery system.
Calculate one branch first:
| Component | ΔP (kPa) |
|---|---|
| 0.6m straight tube (ID 8mm) | 0.85 |
| 3 × 90° bends | 0.45 |
| 5 × cold plates (5kPa each) | 25.00 |
| Branch Subtotal | 26.30 |
Manifold losses add 1.2 kPa. Total loop ΔP = max branch ΔP + manifold = 27.5 kPa.
Also See: IP Ratings and Sealing Methods for Enclosures
Pump Selection and Pressure Drop Interactions
Pressure drop calculations directly determine pump requirements in battery cooling systems. The hydraulic resistance curve dictates pump operating points and energy consumption. Proper matching prevents underperformance or excessive power draw. Accurate liquid cooling pump sizing calculations are essential for optimizing system efficiency and ensuring reliable operation.
Matching Pump Curves to System Resistance
Pump performance curves plot flow rate against developed head. The system curve shows how hydraulic resistance increases with flow rate. The intersection point defines actual operating conditions.
Battery cooling loops require pumps where the curves intersect near the design flow rate. A mismatch causes flow starvation or wasteful oversizing. Centrifugal pumps typically suit most battery thermal management applications. Effective thermal management system design principles focus on optimizing fluid flow and heat exchange to ensure reliable performance in battery systems.
Pressure Drop Implications for Pump Sizing
Total dynamic head (TDH) must overcome the loop’s pressure drop plus static lift. Undersized pumps cannot maintain required flow rates. Oversized units operate inefficiently at partial load.
Calculate TDH as: TDH = ΔPloop + ρgh + dynamic losses. Add 15-20% margin for aging and fouling effects. Most EV battery systems need 30-100 kPa TDH.
Net Positive Suction Head Requirements
NPSHavailable must exceed pump’s NPSHrequired to prevent cavitation. Calculate NPSHa = Patm + Pstatic – Pvapor – ΔPsuction.
Minimize suction line pressure drop to avoid vapor bubbles. Position pumps below reservoir level when possible. For 50°C coolant, maintain at least 0.5m NPSH margin. Proper coolant flow distribution is essential for efficient thermal management. Implementing effective strategies can optimize cooling performance and minimize energy consumption.
Optimizing Pump Efficiency in Battery Cooling Applications
Select pumps operating near their best efficiency point (BEP) at design flow. BEP operation reduces energy consumption by 20-40% compared to off-peak operation.
Variable speed drives adapt to changing thermal loads. They reduce flow during mild conditions, cutting pressure drop by 50% and power by 80% through affinity laws. This optimization is akin to optimizing busbar current density in battery pack design.
Brushless DC pumps offer 60-75% efficiency in battery cooling loops. Size pumps for 70-80% of maximum loop pressure drop to allow for flow adjustments.
Closing Thoughts
Mastering liquid cooling loop pressure drop calculations is vital for efficient battery thermal management. Proper analysis ensures optimal pump selection, balanced flow distribution, and reliable cooling performance.
The interplay between component design, fluid properties, and system architecture directly impacts pressure losses. Strategic optimization can reduce energy consumption while maintaining thermal control.
For more battery pack design insights, explore Battery Pack Design. Our resources cover thermal management, structural analysis, and cutting-edge battery technologies to enhance your designs.